Table of Contents
How can I extract data for analyses ?
In Xplo, some specific tools are available to explore plant architecture databases. On this page, you will see an illustration of various recurrent data extractions.
What kind of tools are available ?
Data extraction can be performed with an interactive tool or by Groovy scripts. The interactive tool can be used by beginners, while Groovy scripts are more dedicated to experts.
Coffee tree data extraction tutorial (J. Dauzat)
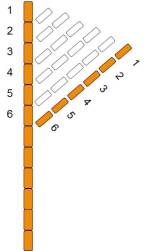
In this example we want to analyze the number of metamers of primary order branches with the number of metamers on the trunk above the branch insertion as illustrated below.

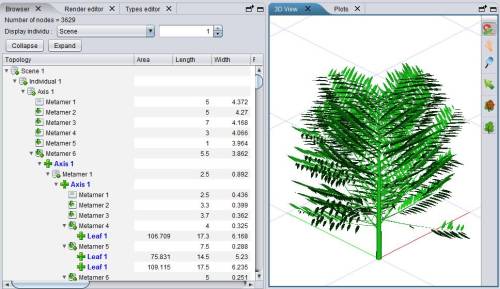
Download and import the file “P6_I59_ni_L1P08.opf” . This coffee tree was completely described in terms of topology and dimensions of its elements. The decomposition scales of the plant (“Individual”) are the Axis scale (trunk and branches) and the Metamer scale: an axis is composed of Metamers and a Metamer is a component of an Axis. Metamers may axil Axes or Leaves.
First we need to select the branches. They are of ramification order 2 (the trunk being of ramification order 1).
- Check that the “Extraction” panel is enabled; if not, tick it in the Window/Display tab
- Click on the “Input” button
- Right click on the newly created “Item” column and select “Type” in “Edit label”. When done the type of each item (e.g. “Axis” or “Metamer” is displayed.
- Enter “Axis” (or just the abbreviation; the letter case doesn’t matter) in the small input field above the item button. When done the selection is restricted to “Axis” items.
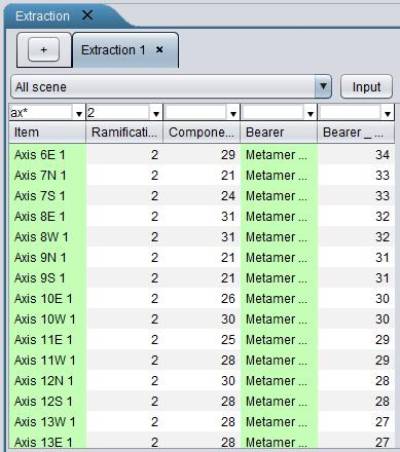
- Right click on the item column and select “Add a column”; then in the dialog panel select “Topology” as “Column type” and “Ramification order” as “Options”. Click “Add” and a new column “Ramification Order” is added in the extraction panel.
- Enter “2” in the small input field above the “Ramification Order” column. We then have only the second order branches selected.
Now we want to know the number of metamers per axis:
- In the “Add a column” panel (if the panel is closed, reopen it by right clicking in the Item column), select “Topology” and then “Components number”.
Now we want to know the position (or rank) of the axis on their bearer axis (i.e. on the trunk). We can do that in 2 operations:
- In the “Add a column” panel, select “Navigation” and then “Bearer”. A new column is added that indicates which trunk metamers bear the selected axes.
- Left click in the “Bearer” column for adding a new column; select the type “Topology” and then select “Position in axis” and tick the “from top” button.
Finally, produce a plot of the number of metamers in axes vs. the number of metamers on the trunk:
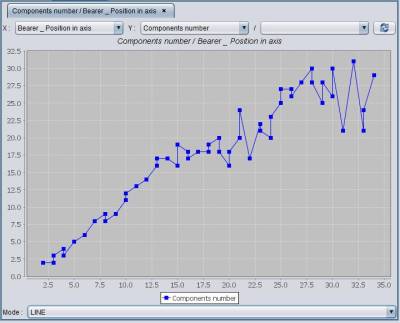
- Select the columns “Components number” and “Bearer_position in axis” (keep “Ctrl” pressed to select the 2 columns) ; right click and select “Plot”
- A plot is displayed (if not, check that “Plots” is enabled in Window/Display)… but we want to switch the X and Y axis. Easy: just reselect the right columns in the combos at the top of the “Plots” panel. Then play with the “Mode” options.
<html><center><i>View of the extraction panel (top) and of the “Plots” panel (bottom)</i></center></html>


